Percent of Total Analysis
Overview
This example builds on the template defined in the “Group Analysis using Break Condition” document. Sample output from that template is shown below.
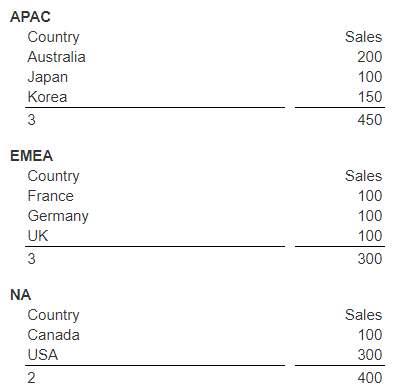
It is a natural question of the data of what percentage of the regional totals do each of the country line items represent.
Basic Template Definition
This example builds on the template defined in the “Group Analysis using Break Condition” document. Locate the template named “Sales by region and country”.
Save it as a new template by clicking
Specify a name of “Sales by region and country with POT”.
Click OK.
Select the group summary cell that displays the total sales.
Update the formula to be
totalSales =sum(#sales)
The result of the summation is set into a variable named “totalSales”. That variable value is now accessible by other downstream formulas via “@totalSales”.
In the grid area click to the right of the body line cell as shown below.
Adding the Percent of Total
In the formula entry field enter
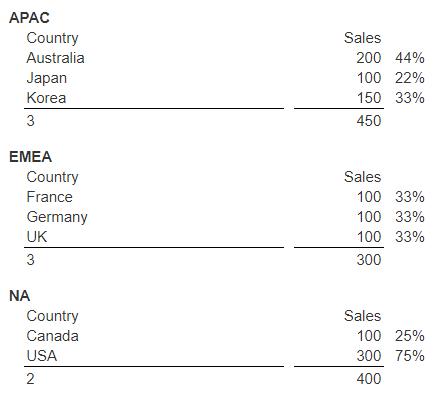
= pot(#sales, @totalSales)
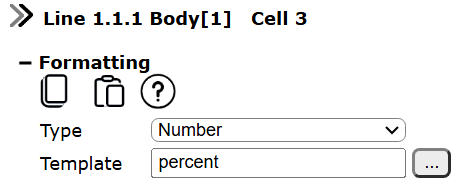
On the far right adjust the formatting for the cell as shown.
Run this by clicking
The output is shown below.
Adding a Grand Total
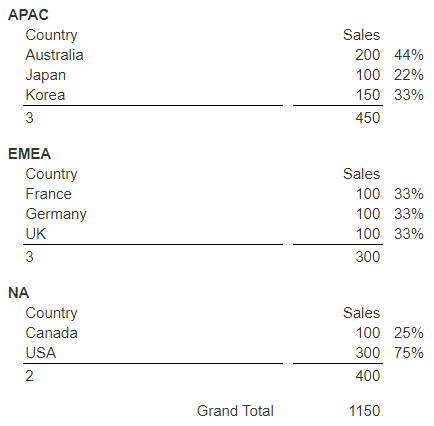
A grand total of sales can be defined by adding a couple of cells to the report summary line.
The second cell’s formula is
grandTotal = sum(@totalSales)
Run this by clicking
The output is shown below.
Adding a Percent of the Grand Total
A similar technique can be done to obtain the percentages of each region relative to the grand total of sales. The group summary line has a cell with this formula
=pot(@totalSales, @grandTotal)
The formatting options are
For readability we will also adjust the default cell widths, tweak the positions slightly, and add some labels. The updated layout looks like the following.

Run this by clicking
The output is shown below.
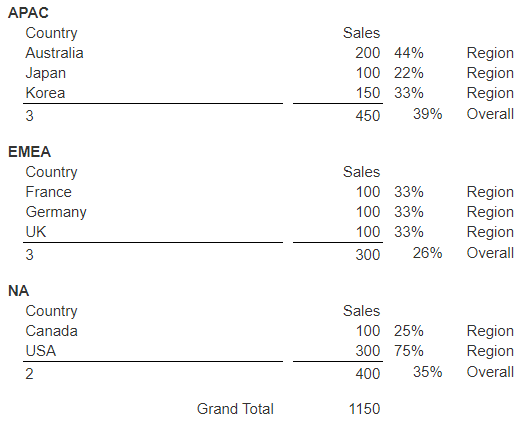
The percent of total are now reported as country within the region, and overall regional values.
Saving the Template
Save the template by clicking.